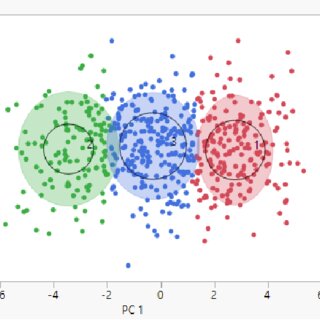

Data mining is the process of discovering patterns, correlations, and trends by sifting through large amounts of data stored in repositories, using various techniques from machine learning, statistics, and database systems.
It involves the extraction of hidden predictive information from large databases and is a powerful tool that can help companies focus on the most important information in their data warehouses.
Gathering relevant data from various sources and preparing it for analysis. This step includes data cleaning, integration, and transformation.
Using descriptive statistics and visualization techniques to better understand the nature of the data, its quality, and the underlying patterns.
Applying appropriate algorithms to discover patterns and relationships within the data.
Using the patterns and relationships found in the data to make decisions or predictions. The interpretation of these results should align with business objectives and needs.

This is a technique used to group sets of objects in such a way that objects in the same group (or cluster) are more similar to each other than to those in other groups. It's widely used in statistical data analysis for various applications, such as pattern recognition, image analysis, and bioinformatics.
Clustering does not use pre-labeled classes; instead, it identifies similarities between data points and groups them accordingly.

This technique involves finding a model (or function) that describes and distinguishes data classes or concepts. The model is then used to predict the class of objects whose class label is unknown.
It's based on training data consisting of a set of training examples. Classification is common in applications where you need to categorize data into predefined labels, such as spam detection in email service providers.

Association analysis is a rule-based method for discovering interesting relations between variables in large databases. It's often used in market basket analysis to find relationships between items purchased together.
For example, if a customer buys X, they are likely to buy Y.

A retail store, through data mining and analysis of their sales data, discovered an interesting association between two seemingly unrelated products: beer and diapers. The analysis showed that these items were often purchased together, particularly on certain days of the week or times of day.
The underlying reason suggested for this pattern was that men, who were tasked with buying diapers, also tended to buy beer for themselves at the same time.
This insight led the store to strategically place these items closer together or run promotions on them simultaneously, thereby increasing sales of both products.

Link analysis is a data analysis technique used in network theory that explores the relationships between objects in a network.
The key concept behind link analysis is understanding how different nodes (or entities) are connected and the strength or significance of these connections.

The U.S. intelligence community used link analysis, constructing and analyzing a network of contacts, communications, and connections around Bin Laden. By examining relationships and interactions among various individuals connected to Bin Laden, analysts were able to map a social network that eventually led to his courier.
The key breakthrough came from identifying and monitoring a courier who was a critical link in Bin Laden's network. This courier exhibited operational security measures that signaled his importance.
By following this courier, U.S. intelligence was able to locate the compound in Abbottabad, Pakistan, where Bin Laden was hiding.
Sequential pattern mining is a topic in data mining concerned with finding statistically relevant patterns between data examples where the values are delivered in a sequence.
It's used in a variety of contexts, such as analyzing customer purchase behavior, web page visits, scientific experiments, and natural disasters.
Forecasting involves using historical data as inputs to make informed estimates or predictions about future events. In the context of data mining, forecasting is often associated with time-series data analysis, used for predicting future trends based on past data.
Common applications include stock market analysis, weather forecasting, and sales forecasting.

Linear regression is a core statistical and machine learning technique used to predict a continuous outcome variable (dependent variable) based on one or more predictor variables (independent variables). The goal is to model the linear relationship between the dependent and independent variables.
Example usage:
In supervised learning, the algorithm is trained on a labeled dataset. This means that the input data is paired with the correct output.
It's used for tasks like classification (e.g., spam vs. non-spam) and regression (e.g., predicting house prices).
The model learns from the training data and then applies this learned knowledge to make predictions or decisions on new, unseen data.
Unsupervised learning involves training an algorithm on a dataset without predefined labels. The system tries to learn the patterns and structure from the data. The model explores the data to find patterns or groupings, often revealing hidden structures within the dataset, and is used for clustering and association tasks, as well as dimensionality reduction.